Example – heat recovery and system expansion
Generic product activity or name
Industrial heat recovery.
Synonyms
Co-production of heat, excess heat.
Context and background
Numerous cities in northern Europe have centralised their distribution of heat, and while most of them rely on dedicated means of heat supply (e.g. gas, biomass or coal-fired heat plants), some of them welcome the co-produced heat from the surrounding industries. The consequential modelling of co-producing systems allows to better consider the net environmental changes following the supply of a given co-product to the receiving market. In the case of the supply of recovered heat, a good understanding of the structural capacity of the receiving system is needed.
Presentation of example
The city of Aalborg has a district heating system that supplies heat to 36,602 households (approximately 6800 TJ in 2015). The heat supply coordinating agency gives first priority to the supply of co-produced heat from industrial process, such as the local cement factory (which makes up for 17% of the average current supply), and the waste CHP plant (21%). The remaining demand for heat is completed by the municipality-owned coal-fired CHP plant “Nordjyllandsværket” (approximately 61%).
The LCA modelling of cement production implies that the system and economic changes following an additional supply of heat to the city’s district heating system be accounted for. However, the time horizon chosen in the LCA (which reflects the time span over which the marginal system changes are accounted for) may greatly affect the conclusion of the study.
Within the current configuration of the district heat supply
Currently, an increase of demand for Portland cement (designated by +α in Figure 1 below) leads to the co-delivery of recovered heat from cement production to the district heating system (designated by +β). It affects the short-term marginal heat supplier, namely the coal-fired CHP.
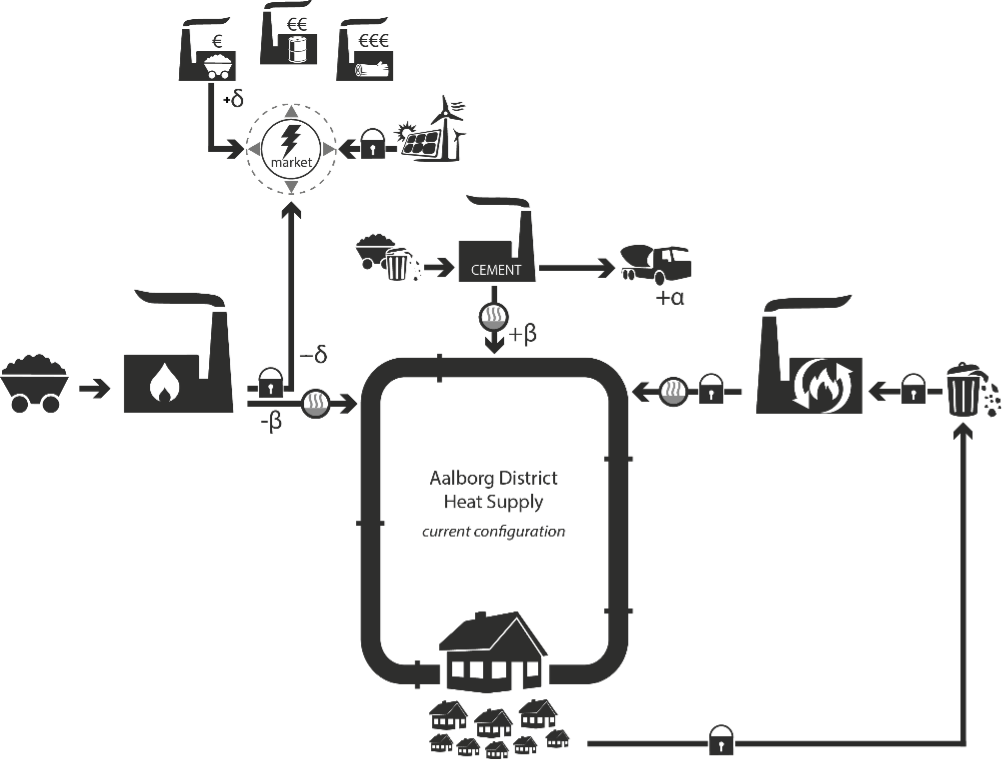
Figure 1: System changes within current configuration.
The coal-fired CHP is an instance of joint-production (where the additional production of heat leads to a production of electricity), the production of heat being the determining product. With an initial matching demand and supply of heat in the system, an additional amount of co-produced heat delivered by the cement factory will have the coal-CHP to short-term adjust its heat production (to the extent of -β) thereby also affecting its delivery of electricity (to the extent of -δ): this translates by an equivalent amount of electricity produced by the marginal technology with the capacity to short-term adjust to demand fluctuations (to the extent of +δ).
The marginal supplier that will be affected in the short term by an increase in demand is identified as the technology that is deemed the least economic to operate, among those that have the technical capacity to adjust their production within the given timeframe. It is indeed assumed that, on a well-functioning market at equilibrium, each supplying technology delivers an economically optimal output. The least-competitive technologies usually undersupply and are often used as a variable for adjustment.
A look at hourly electricity generation and consumption data for Denmark in 2016 can help to identify these technologies. Figure 2 reveals an interesting pattern (highlighted by the vertical yellow shades): where the market is undersupplied (i.e. when the generated amount is below the red load curve), gas and coal-fired power plants (green-shaded series) kick in to limit the need for import.
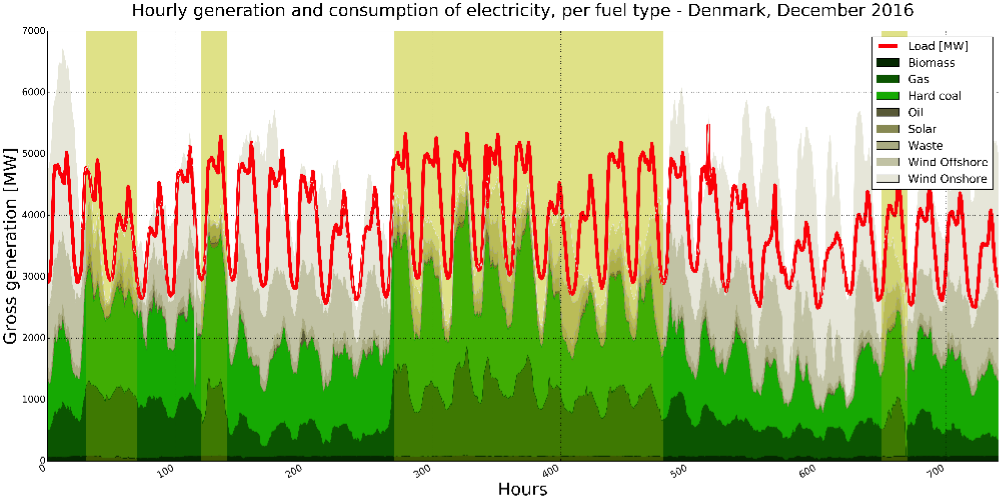
Figure 2: Hourly electricity generation and consumption, Denmark, December 2016. Source: ENTSO-E
There is in fact a significant correlation between the changes in demand for electricity and the generation of gas- and coal-based electricity in Denmark for the year 2016 – a Pearson correlation coefficient of .56 and .53 for gas and coal respectively, while the other technologies are largely uncorrelated, with Pearson coefficients <0.1. This relation is illustrated in Figure 3 – for ease of read, only the last 200 hours of December 2016 are shown.
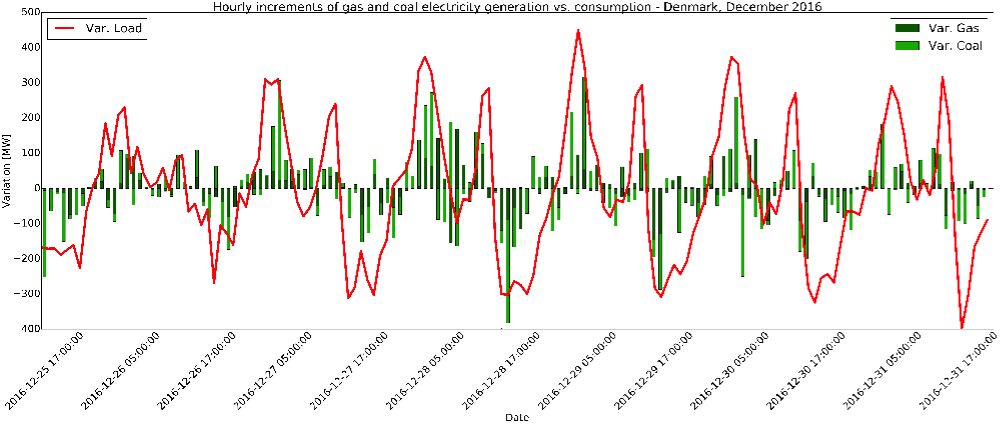
Figure 3: Hourly variation of gas and coal electricity (bars) and consumption (line).
Hence, within the current settings, the co-delivery of 1 GJ of net industrial excess heat by the cement factory to the district heating system of Aalborg is likely to avoid the use of about 78 kg of coal by the dedicated local coal-based heat supplier (efficiency figures taken from the plant’s 2014 environmental report) but also lead to further produce .22 MWh of electricity by means of coal and gas combustion among the current electricity suppliers.
However, these short-term effects are only a part of the picture. Consequential modelling usually gives more importance to the environmental impacts associated to long-term structural changes in the studied system, simply because these long-term changes (in generation capacity) last longer and therefore dominates the result of the consequential analysis. The long-term changes oppose the sporadic nature of the consequences observed in the short term by focusing on the lasting nature of investments in the installed supply capacity, responding to the changes in supply and demand for district heat, in our example.
Structural changes to the local district heat supply
This section looks at the long-term structural changes on the local district heat market of Aalborg that is affected by the marginal co-delivery of heat from the cement factory.
According to the Aalborg’s Energy Vision 2050 study, the demand for centralized heat could follow the Energy Vision 2050 (incl. Aalborg Portland) scenario, where the gross demand for heat would decrease by 44% compared to 2007 (down to 4612 TJ compared to 6800 TJ) as a result of an improvement by 50% of the insulation of building envelopes, despite an expansion of the network to reach outer municipalities.
In order to achieve such a scenario, the Aalborg Energy Vision 2050 programme envisages the following measures:
- Progressively halt the heat supply from the coal-fired CHP
- Exploit the opportunities of geothermal energy
- Further expand the recovery of excess industrial heat
- Increase the provision of heat from biomass-fired CHP
- Reduce the heat demand and retrofit the existing infrastructures to reduce heat losses
The provision of heat by the waste CHP is believed to remain stable over time, if not slightly increasing to adjust to population increase and economic fluctuations.
A remaining part of the demand will be met by decentralized solutions such as heat pumps and individual biomass/wood pellets boilers.
The decrease in heat supply from the coal-fired CHP is expected to progress faster than the natural decrease in demand for centralized heat, as a result of a planned decommission by 2030. Until then, the coal-fired CHP will remain the marginal capacity regulator affected by the co-delivery of heat from the cement factory, scaling maintenance and retrofitting to the (maximum) capacity necessary to fill the maximum demand under the forecasted demand and supply situation. The change in heat capacity caused by the co-delivery of heat from the cement factory is denoted as –β in Figure 4 below.
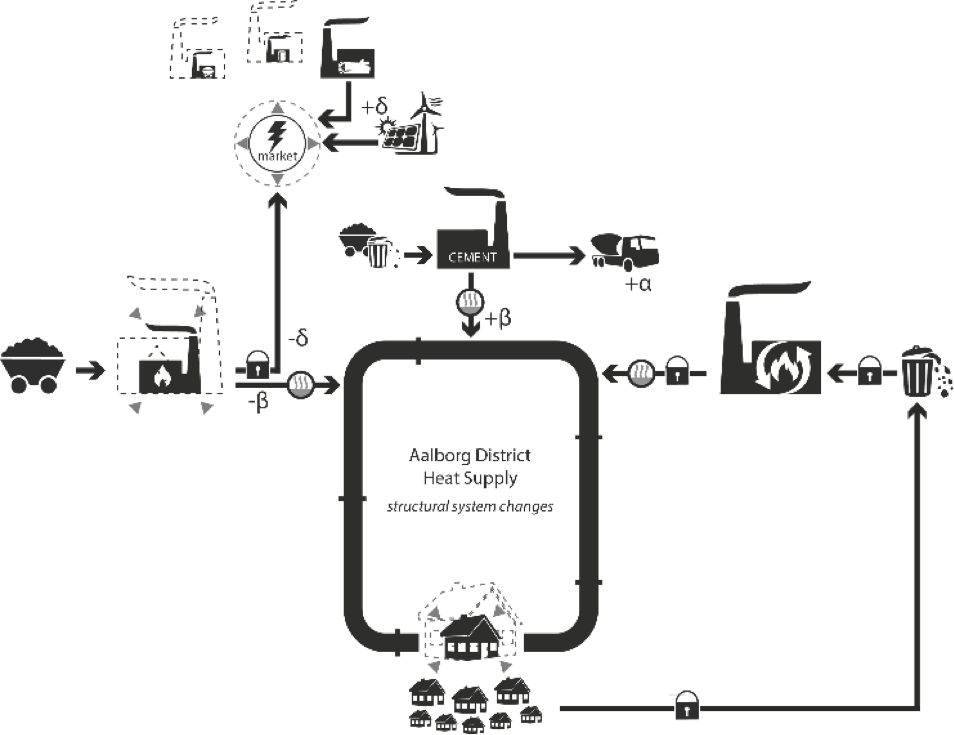
Figure 4: System changes on the long term.
The electricity supply capacity from the coal-fired CHP will be affected the same way (to the extent of -δ), leading to an additional demand (to the extent of +δ) from the long-term marginal electricity technologies, identified as a mix of wind power, biomass-fired CHP, solar power and increased exchanges with neighbouring countries – more on the identification of long-term marginal suppliers of electricity can be read in our case on electricity in Denmark.
By 2030, the coal-firing capacity of the CHP plant will be replaced by fuel cells. There will also be a capacity adjustment of the decentralized CHP units around Aalborg (as well as a progressive shift towards the use of biomass fuels). The marginally affected supplier beyond that point in time will probably be one of the grid-connected heat suppliers with a certain degree of adjustment capacity (like natural gas-fired CHP units) as opposed to individual solutions, since they evolve on different markets.
Information sources used
This example is based on the PhD work by the author “Modeling the environmental impacts and potentials of cement production, a major building material in sustainable housing”.
References
ENTSO-E 2016. Transparency Platform: https://transparency.entsoe.eu/
Vattenfall A/S 2014. Nordjyllandsværket 2014 Grønt regnskab.: https://corporate.vattenfall.dk/globalassets/danmark/om_os/gronne_regnskaber/nordjyllandsvaerket-groent-regnskab-miljoeberetning-2014.pdf
Miljø- og Energiforvaltningen 2015. Strategiplanlægning 2016-2019, Aalborg Forsyning, Aalborg.
Aalborg Kommune 2015. Nordjyllandsværket/Overskudsvarme, Aalborg Energi.: http://referater.aalborgkommune.dk/Pdf.aspx?pdfnavn=16499339-13819759-3.pdf&type=bilag&id=36655 (Link no longer live.)
Danish Energy Authority 2016. International reporting of electricity production 1990-2014, Energistyrelsen, Copenhagen, Denmark: https://ens.dk/sites/ens.dk/files/Statistik/int.reporting_2014_1.xls
Østergård PA (ed.) 2010. Energivision for Aalborg Kommune 2050. Institut for Samfundsudvikling og Planlægning, Aalborg Universitet: http://www.energyplanning.aau.dk/Publications/AalborgKommune-EnergivisionBaggrundsrapport.pdf
Author of this example
Romain Sacchi
Date
2017-01-09
How to reference this
Sacchi R (2017), Example – Heat recovery and system expansion. Version: 2017-01-09. www.consequential-lca.org