Example – Marginal copper production
Generic product activity or name
Copper
Synonyms
Cu
Context and background
Copper mine production has been subject to a 36-fold-increase from the early 20th century to today (ICSG, 2015). Primary copper production starts with the extraction of copper‐bearing ores, either by surface mining (predominant method in the world), underground mining or leaching. After the ore has been mined, it is crushed and ground for its further concentration by flotation. Copper can then be produced either pyrometallurgically or hydrometallurgically. In the pyrometallurgical route, copper is first smelted into a “matte” containing 50-70% copper, sometimes with the implementation of a preceding roasting step. The molten matte is processed in a converter, resulting in a so‐called blister copper that is fire refined in the traditional process route or, increasingly, re‐melted and cast into anodes for electro‐refining. The output of electro‐refining is refined copper cathodes, assaying over 99.99% of copper (ICSG, 2015). Primary smelters use mine concentrates as their main source of feed (although some use copper scrap as well), whereas secondary copper smelters use copper scrap as their feed. Alternatively, in the hydrometallurgical route, copper is extracted from mainly low-grade oxide ores and also some sulfide ores, through leaching (solvent extraction) and electrowinning (SX‐EW process), resulting in refined copper cathodes.
Presentation of example
Current marginal copper production
In the case of steel on this site, Weidema (2016) mentioned that steel scrap is by definition a constrained raw material since it is not the driver (determining product) in its production process. As a consequence, the BOF technology is the only one affected by a change in demand for more steel: it is the marginal steel production technology. Similarly, in the case of copper, the use of copper scraps in smelters is constrained by the availability of these scraps. The primary copper production route is the marginal copper production.
Exploring the data of copper mine production by each region of the world from 1990 to 2011 (Mudd et al 2012), we observe that the annual Chilean copper mine production has dominated the global copper production growth during this period, whereas the productions from other regions of the world have either decreased/stagnated (e.g. USA, Canada, Europe) or contributed to a much lower extent to the increase in global copper production (e.g. China, Australia). In 2014, with mine output of almost 5.75 million tonnes copper, Chile accounted for almost one‐third of world copper mine production and was the world major exporter of copper ores and concentrates (ICSG, 2015). Therefore, the Chilean copper concentrate production (including copper mine extraction and concentration) can be considered the marginal copper concentrate production.
The annual Asian refined copper production has dominated the global copper production growth from 1990 to 2014, whereas most other productions have either decreased/stagnated (Europe, America, Oceania) or contributed to a much lower extent to the increase in global refined copper production (Africa; ICSG, 2015). In 2008, China was the largest refined copper producer in the world: its refined copper production reached 3.79 million tonnes, 2.8 times that of its production in 2000 (Shang et al., 2011). In 2014, China accounted for over a third of world copper smelter production, followed by Japan (9%), Chile (8%) and the Russian Federation (5%; ICSG, 2015). The increase in annual Chinese refined copper production therefore dominates the increase in annual Asian refined copper production. Accordingly, Chinese primary copper refining is the marginal refined copper production.
Whereas the hydrometallurgy of copper was hardly implemented several decades ago (standing for less than 1% of world refined copper production in the late 1960’s), refined copper produced from leaching ores represented 18% of world output in 2013 (ICSG, 2015). Yet, in China, depicted as the marginal refined copper producer in the above paragraph, pyrometallurgy remains largely predominant. The proportion of Chinese SX-EW copper output to Chinese refined copper output represented only 2.5% in 2009, despite this stood for a 2.5-fold increase between 2001 and 2009 (Shang et al., 2011). At a world scale, the use of Flash/Continuous technology, which accounted for 56% in total copper smelting capacity in 1998, increased up to almost 70% in 2014 (ICSG, 2015). On the contrary, the share of other technologies (in particular reverbatory, blast and rotary furnaces) decreased. Accordingly, Chinese primary copper refining is the marginal refined copper production, as mentioned in the above paragraph, with Flash/Continuous technology as the marginal technology.
Prospective scenarios for copper marginal production
Life Cycle Assessment studies may require the analysis of the consequences of a decision (e.g. of a policy decision) that will be enforced later in the future. As an example, we can mention policies relative to the energy transition that will induce changes in energy infrastructures along several decades (e.g. towards a target content in renewable energies in the energy production mix in France in 2050). In the above paragraph, marginal copper supply was determined based on recent past data. Yet, “future average behaviour, as well as future marginal changes, are different from those that can be predicted by extrapolating data from the recent past” (Weidema, 2016).
The future global copper production by countries and regions as modelled by Northey et al. (2014), by use of GeRS-DeMO in dynamic demand mode, may for example be used as a basis for the setting of prospective marginal copper production (here limited to copper ores and concentrates, but not to refined copper that would require further data and analysis). Considering this modelling, and limiting our study to the determination of marginal copper production in the years 2020, 2030, 2040 and 2050, two time periods may be distinguished:
- from 2010 to 2030, the global copper supply is modelled to increase. The contribution of each country and region (e.g. Chile, China, etc.) to the copper marginal production mix in 2020 is calculated as the difference in output between end and beginning of the period 2010-2020 (only for the regions having increases in output in that period), divided by (i.e. expressed as a percentage of) the sum of the total difference for all these regions. The marginal production mix in 2030 is calculated according to the same approach, considering the period 2020-2030 instead of 2010-2020. The main marginal copper suppliers in 2020 are Chile and Zambia (respectively 26 and 16% of the future marginal production mix; Table 1), with contributions from Former Soviet Union and Peru to the total mix amounting to 10% each. Considering the same calculation approach, Chile (23%), Democratic Republic of Congo (20%), and to a lower extent Australia and Peru (9%) are the main marginal suppliers in 2030 (Table 1).
- from 2030 to 2050, the global copper supply is modelled to decrease. The marginal supply mix is calculated in the same way as that described above regarding the period 2010 to 2030, but considering decreases instead of increases. Using results from the Northey et al scenario (2014) as a basis for our calculations, the main marginal suppliers are Zambia (33%), Democratic Republic of Congo (19%) and Former Soviet Union (18%) in 2040, and Former Soviet Union (21%), Democratic Republic of Congo (18%) and Chile (18%) in 2050 (Table 1).
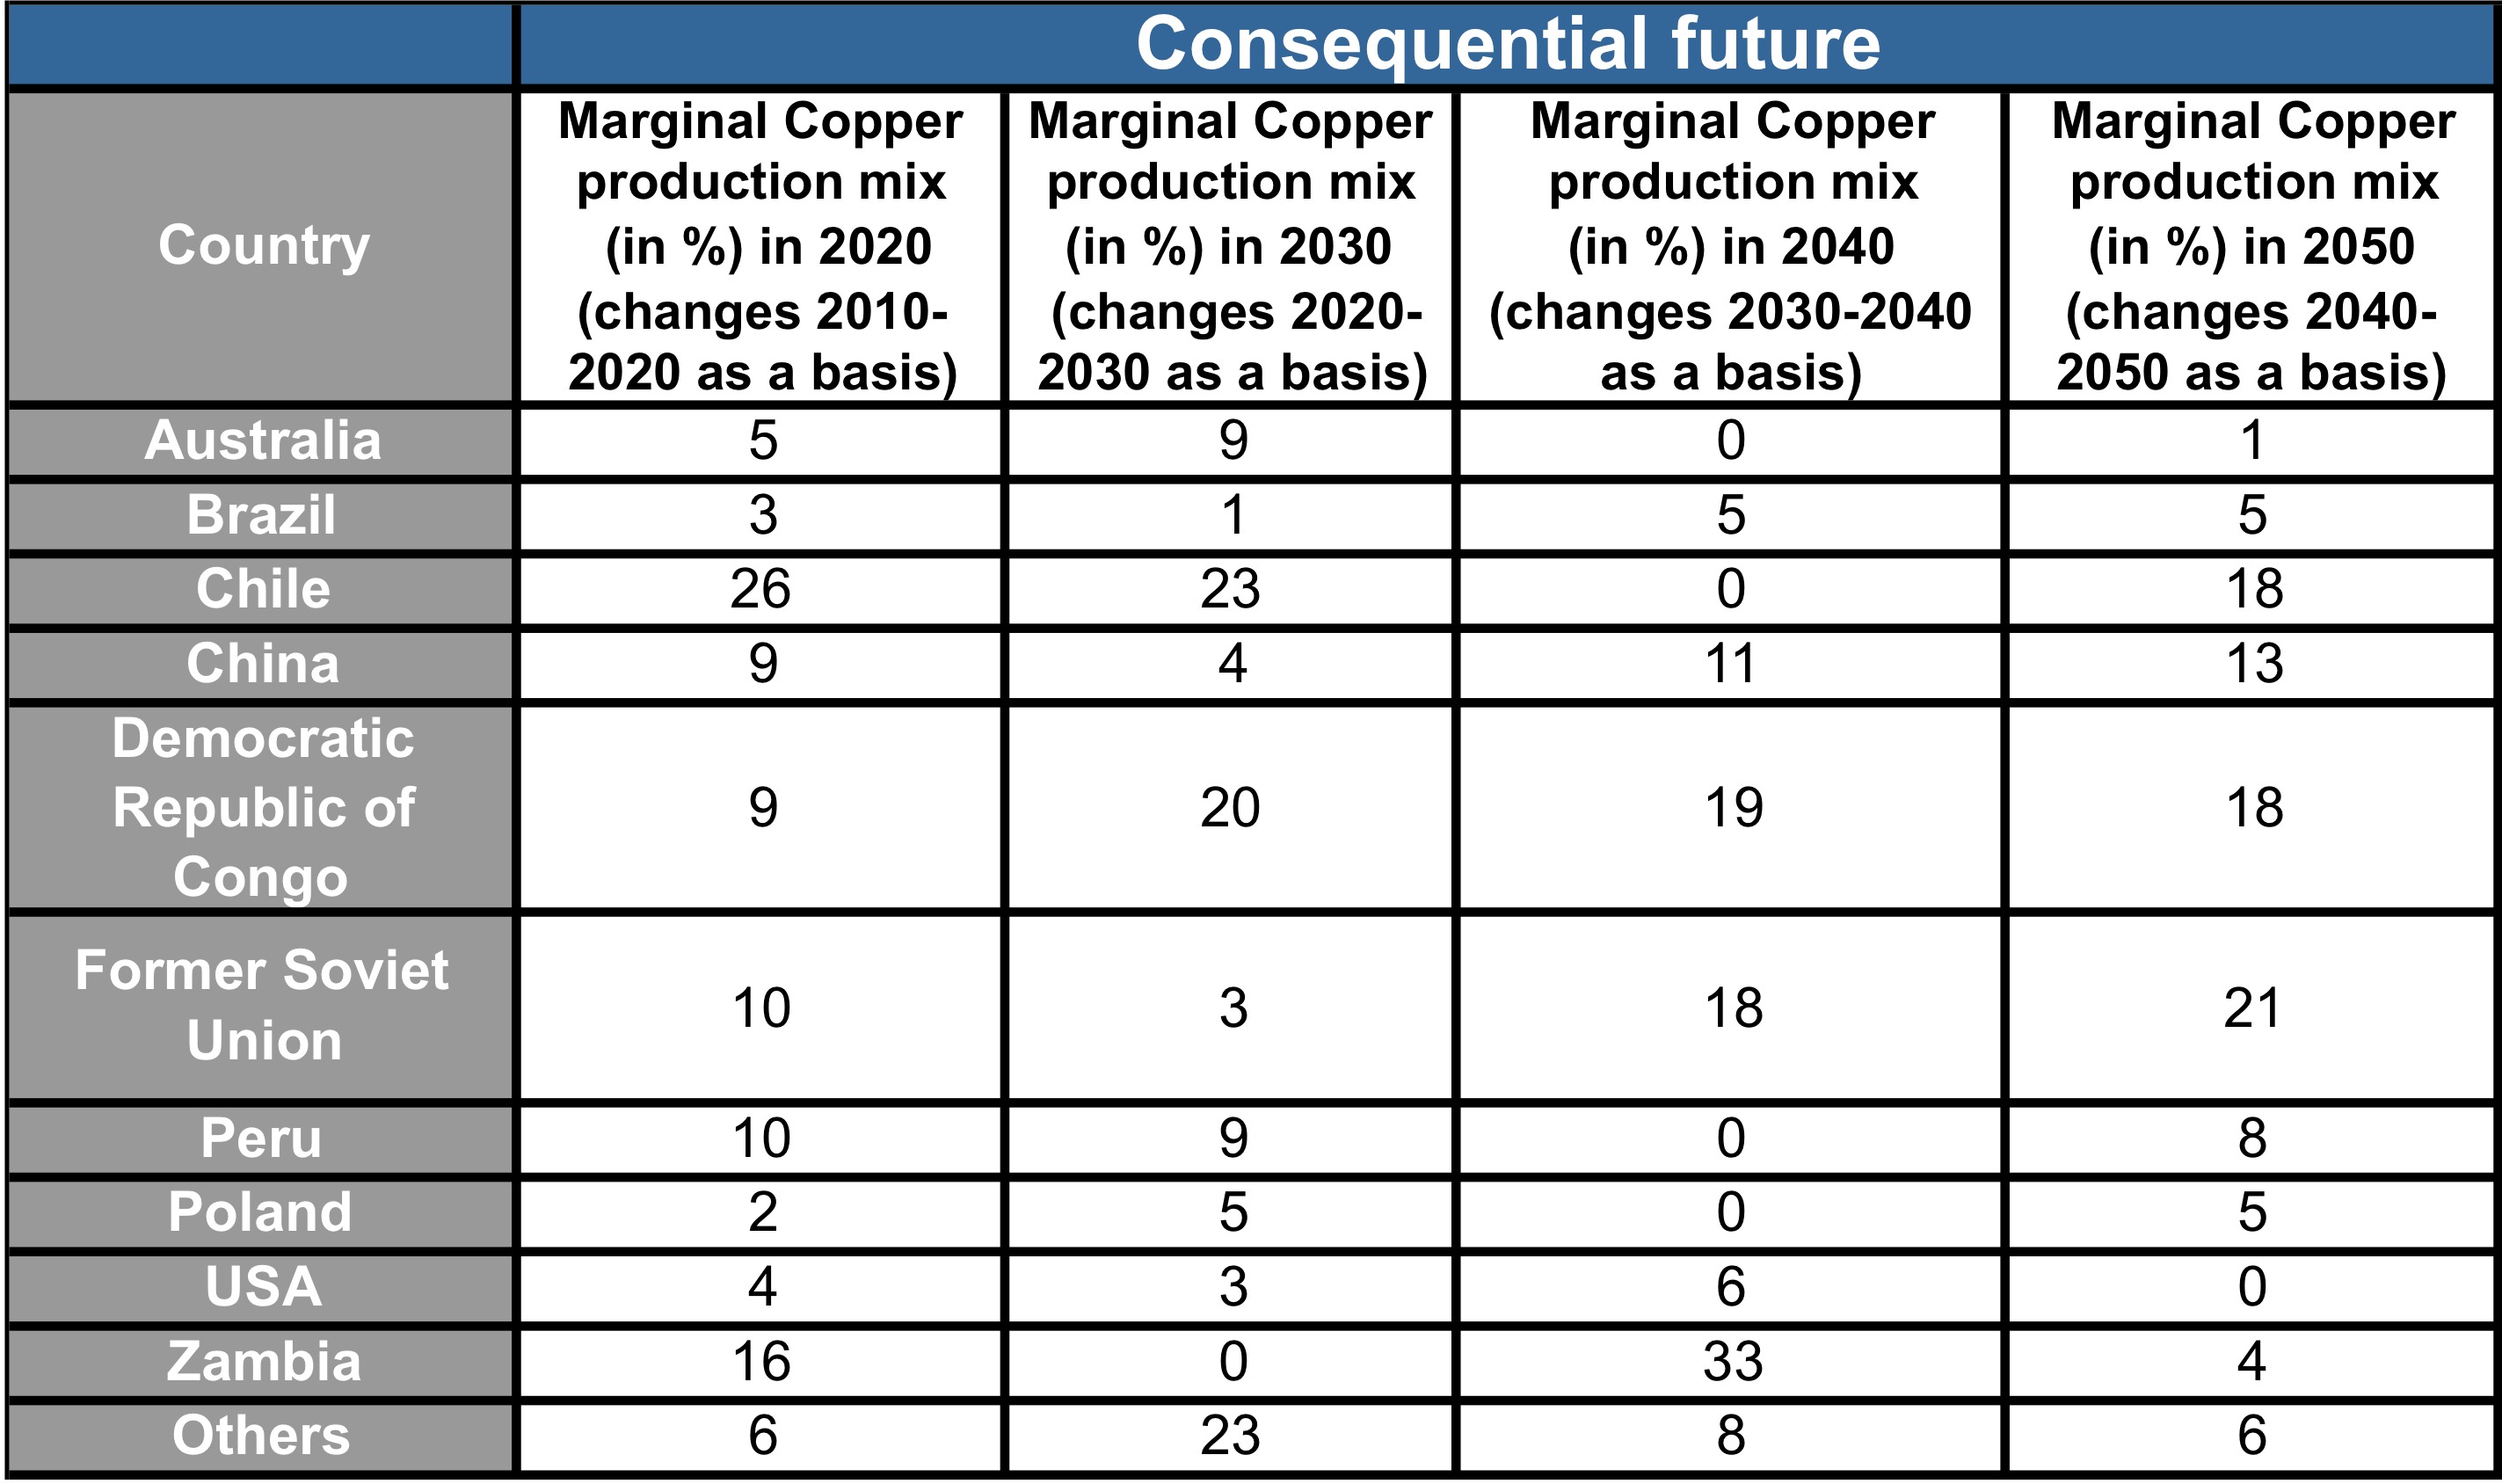 Table 1: Prospective copper marginal production mix, using results from Northey et al. (2014) on the modelling of global Cu production by countries and regions as a basis (by GeRS-DeMO in dynamic demand mode).
Information sources used
Trade statistics and forecasts are available from the International Copper Study Group (ICSG).
References
ICSG, 2015. The World Copper Factbook 2015. International Copper Study Group.
Mudd, G. M., Weng, Z., Memary, R., Northey, S.A., Giurco, D., Mohr, S., Mason, L. 2012. Future Greenhouse Gas Emissions from Copper Mining: Assessing Clean Energy Scenarios. Cluster Research Report. N° 1.12. October 2012.
Northey, S., Mohrb, S., Mudd, G.M., Wenga, Z., Giurco, D. 2014. Modelling future copper ore grade decline based on a detailed assessment of copper resources and mining. Resources, Conservation and Recycling 83 (2014) 190–201
Shang, F, Zhao, B, Duan, S, and Zhou, Z, 2011, Sustainable Development of the Chinese Copper Market, International Institute for Sustainable Development. IISD. January 2010.
Weidema B P (2016), Example –constraints on steel production. Version: 2016-07-22 www.consequential-lca.org
Weidema B P (2016). Consequential LCA is not scenario modelling. March 13th, 2016. http://lca-net.com/blog/consequential-lca-is-not-scenario-modelling/
Author of this example
Antoine Beylot
Date
2017-05-22
How to reference this
Beylot A (2017), Example – Marginal copper production. Version 2017-05-22. www.consequential-lca.org