Example – marginal aluminium production
Generic product activity or name
Aluminium
Synonyms
Alumina, aluminium oxide, aluminum
Context and background
In 2010, the global production of primary aluminium was 41.2 million tonnes, about twice as much as in 1990 (IEA, 2012). Primary aluminium production starts with the mining of bauxite, and is then accomplished in two phases:
– firstly the Bayer process of refining the bauxite ore to obtain aluminium oxide. Alumina is separated from the bauxite by using a hot solution of caustic soda and lime. The mixture is heated and filtered, and the remaining alumina is dried.
– and secondly the Hall-Héroult process of smelting the aluminium oxide to release pure aluminium. Today, there are two primary technologies using the Hall–Héroult process, respectively the Prebake and Søderberg technologies.
Secondary aluminium is produced by melting scrap metal in a furnace. Production of secondary aluminium consumes less than 5% of the energy needed to produce primary aluminium. It accounts for 33% of today’s global supply and is expected to rise to 40% by 2025 (IEA, 2012).
Presentation of example
Current marginal aluminium production
In the case of constraints on steel production on this site, Weidema (2014) mentioned that steel scrap is by definition a constrained raw material since it is not the driver (determining product) in its production process. As a consequence, the BOF technology is the only one affected by a change in demand for more steel: it is the marginal steel production technology.
Similarly, in the case of aluminium, the melting of aluminium scraps in a furnace is constrained by the availability of these scraps. The primary aluminium production route is the marginal aluminium production.
Exploring the data of alumina production by each region of the world from 2000 to 2016 (Figure 1), we observe that the growth in Chinese alumina production dominated the growth in world production. In the meantime, the production of alumina in other regions of the world was relatively constant. Similarly, from 2000 to 2016, the growth in Chinese primary production dominated the growth in world primary aluminium production, whereas the production from other regions of the world was relatively constant (Figure 2). From these recent past data, we can conclude that China is both the marginal alumina supplier and the primary aluminium supplier.
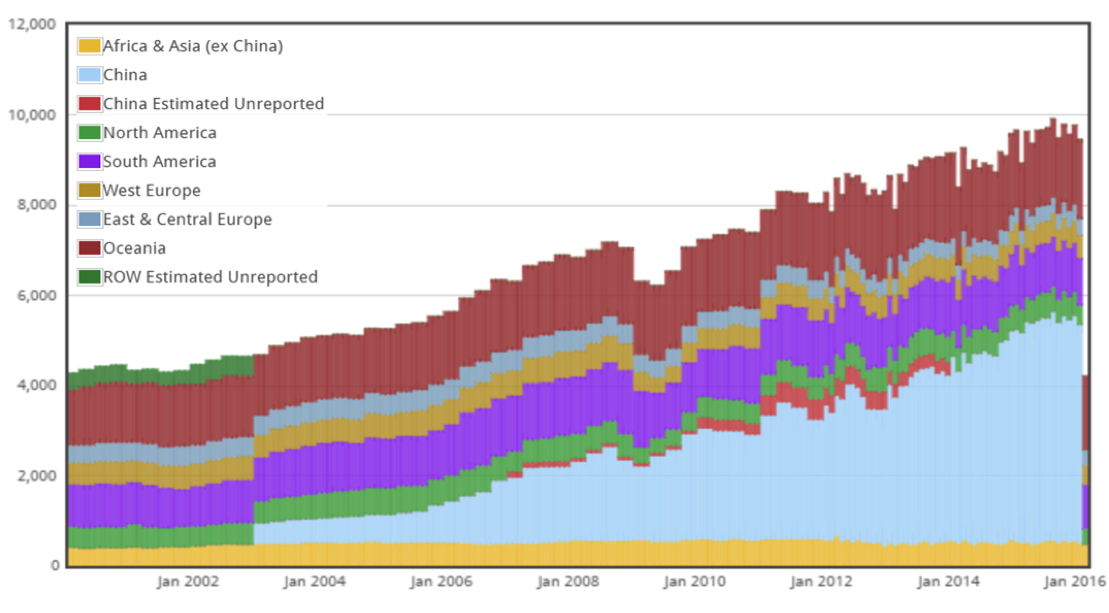
Figure 1: Alumina production (in thousand metric tonnes), by regions of the world, from 2000 to 2016. Reproduced with permission from World Aluminium, June 2016.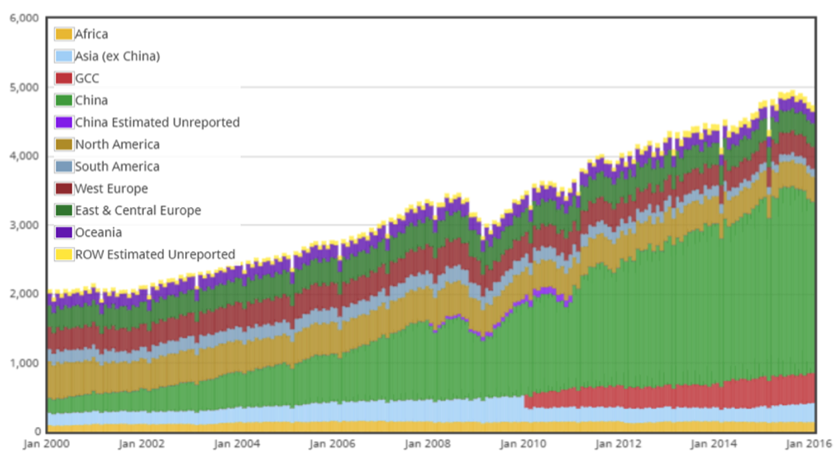
Figure 2: Primary aluminium production (in thousand metric tonnes), by regions of the world, from 2000 to 2016. Reproduced with permission from: World Aluminium, June 2016.
The use of the Prebake technology for worldwide primary aluminium production has increased from about 63 % in 1990 to about 90 % in 2010, while the use of the Søderberg technology has decreased in the meantime (IEA, 2012; and Figure 3). Primary aluminium production from Point Fed Prebake route has increased in this period, whereas on the contrary, the production from other routes remained constant or even decreased. In the end of the 1990s, Chinese primary aluminium was entirely produced in Søderberg plants. Most of these have converted to prebake smelting technology in the early 2000s (CRU, 2006), so that Chinese primary aluminium is now entirely produced from Point Fed Prebake smelters (World Aluminium, 2013). Therefore, China is the marginal aluminium supplier (as mentioned above) with Point Fed Prebake technology as the marginal aluminium technology.
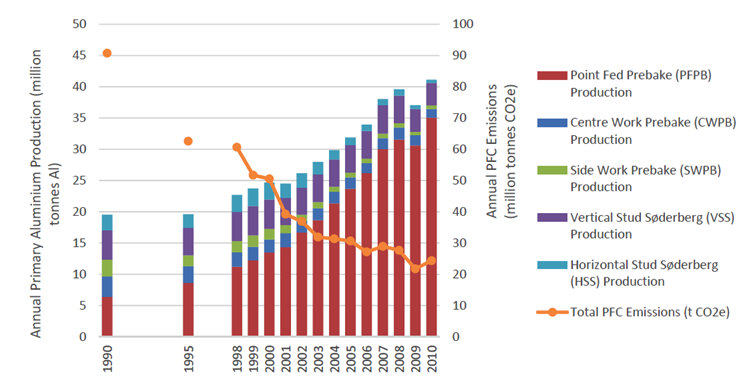
Figure 3: Global annual primary aluminium production as a function of production routes, from 1990 to 2010 (Reproduced with permission from World Aluminium, June 2016).
Most aluminium smelters around the world are equipped with their own captive power plants to meet their energy needs (AluWatch, 2015). In China, the power consumption for primary aluminium production has increased by a factor 8.7 between 2000 and 2014. The Chinese smelting power consumption mix has remained relatively constant in this period, with coal as the main energy source (Figure 4; 90% of coal and 10% of hydropower in 2014). In the recent past, the increase in power consumption required to satisfy the increase in primary aluminium production in China has therefore been mainly satisfied by the combined use of coal and hydroelectricity. In this specific case, the (average) electricity consumption mix (90% of coal, 10% of hydropower) is also the marginal electricity mix for marginal aluminium production.
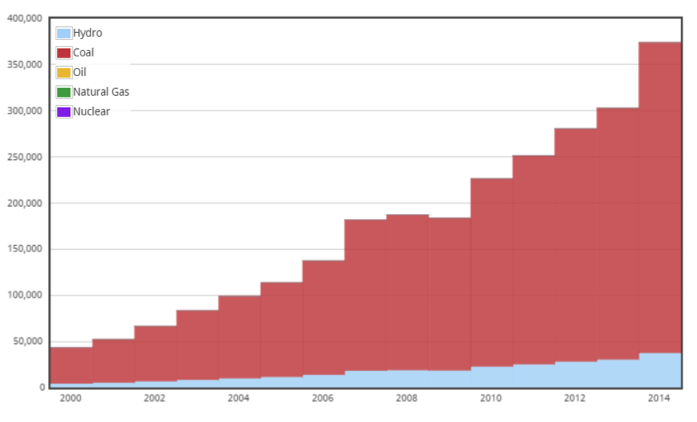
Figure 4: Primary Aluminium: smelting power consumption in China, in GWh, from 2000 to 2016. Reproduced with permission from World Aluminium, 2016.
Information sources used
For current statistics we refer to World Aluminium at: http://www.world-aluminium.org/statistics/
References
AluWatch, 2015. Aluminium and GHG emissions: are all top producers playing the same game? Lessons from existing empirical studies and policy implications
CRU, 2006. Northwest Smelter Operating Outlook. A report prepared for Alcoa. CRU Strategies. May 2006.
IEA, 2012. Aluminium Production. IEA ETSAP – Technology Brief I10 – March 2012 – www.etsap.org (Pdf-file).
Weidema B P (2014), Example –constraints on steel production. Version: 2016-07-22 www.consequential-lca.org
World Aluminium, 2013. Global Life Cycle Inventory data for the primary aluminium industry. 2010 Data. Final. August 2013
World Aluminium, 2016. Current IAI statistics. Available at: http://www.world-aluminium.org/statistics/
Author of this example
Antoine Beylot
Date
2016-06-15
How to reference this
Beylot A (2016), Example – Marginal aluminium production. www.consequential-lca.org