Example – marginal electricity in Denmark
Generic product activity or name
Electricity.
Synonyms
Power generation.
Context and background
Consequential LCA studies the consequences of a change in demand for a product or service, and for this reason only marginal suppliers are considered in the system. However, identifying the marginal suppliers of electricity may present a number of special challenges because this requires not only knowing the local production capacity but also to understand the energy regulation and politics affecting the current and future regional and local electricity production. This example discusses the situation in Denmark.
Presentation of example
As explained in the example on forecasting, the most precise data for predicted power generation is constituted by official forecasts in the next 5 to 10 years. In this example, though, we show how recent historical trends can be used in a similar fashion as forecasts. Table 1 presents the supply of electricity in Denmark in 2014 and 2019. This includes domestic production as well as imports. Data on domestic supply are obtained from the International Energy Agency (IEA 2021), while the total amount of imported electricity by country of origin is obtained from the Comtrade database (UN 2021).
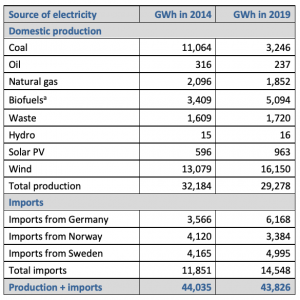
Table 1: Data for power generation and imports in Denmark 2014 and 2019. Based on data from the IEA for domestic production (IEA 2021) and on the COMTRADE database for imports (UN 2021).
a Mainly woody biomass.
As can be seen in table 1, in the period from 2014 to 2019, the overall electricity demand in Denmark was kept approximately constant (it registered a slight decrease of 0.5%). However, the demand is still not decreasing faster than the replacement rate of even the shortest-lived technologies. This market situation helps us to focus on some of the suppliers in the table, namely those that are based on a modern, competitive technology and can react to an up-ward change in demand with a capacity adjustment.
When considering a proposal for marginal suppliers, it is important that these are not constrained i.e. due to limitations on available raw materials or due to political restraints. In table 1 we can see that waste increased its contribution to electricity supply, however this is increase is driven by an increase in waste disposal (incineration) than an increase in demand for electricity. Thus, waste can be considered as a constrained source of energy and therefore it can be excluded from the list of marginal suppliers. Regarding renewables, these are not constrained, since Denmark has political targets in place to increase the proportion of e.g. woody biomass as well as the solar and wind energy. In Table 1 we can see that fossil-based sources, namely coal, oil and gas decreased their production in 2014-2019, while renewable sources increased their production in this period. At the same time, the statistics show an increasing dependence on imports from neighbouring countries in order to meet Danish demand. In particular, imports from Germany and Sweden increased in the assessed period, while those from Norway decreased. Based on these trends, production from renewables coupled with imports from Germany and Sweden are expected to constitute the long-term marginal suppliers.
To calculate the actual electricity mix we need to calculate the share of each marginal supplier respect to the total change in generation in the assessed period of time, at the same time taking into account the capital replacement rate, which is different for each technology (NREL 2010). In addition to domestic generation, this calculation needs to take into account the contribution from imports by country (Table 2).
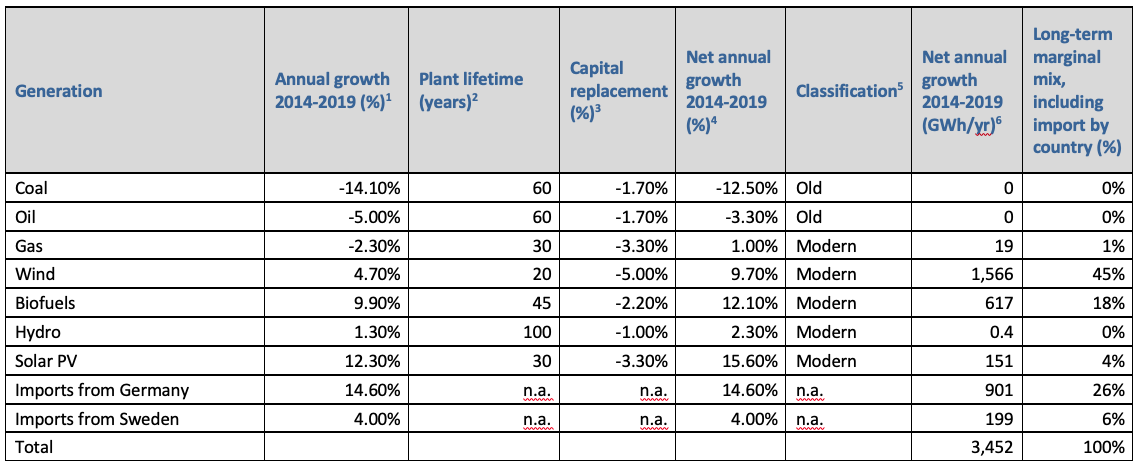
Table 2: Calculation of the long-term marginal electricity mix for Denmark, based on generation shown in table 1 and including imports from Germany, Sweden and Norway. Legend below table.
1 Taking generation in 2014 as 100%.
2From NREL (2010), except hydropower from NREL (2004).
3Calculated as the inverse of the plant lifetime, with a minus sign.
4Calculated as the annual growth 2014-2019 minus the capital replacement rate.
5If the annual growth is lower than the capital replacement rate, the technology is considered as old.
6Calculated as the generation in 2019 (in table 1) times the net annual growth.
n.a.: not applicable
In Table 2 we can see that 32% of the marginal supply originates in Germany and Sweden. In order to break down this contribution into individual generation technologies, as we have done for domestic Danish generation, we use the detailed electricity statistics for these two countries shown in Table 3, while the marginal supply for export is calculated in Tables 4 and 5.
Table 3: Data for power generation in Germany and Sweden in 2014 and 2019. Data from IEA (2021). Note: imports to these countries are assumed to be irrelevant for export, i.e. that these countries are not transit countries for electricity to Denmark from other countries. 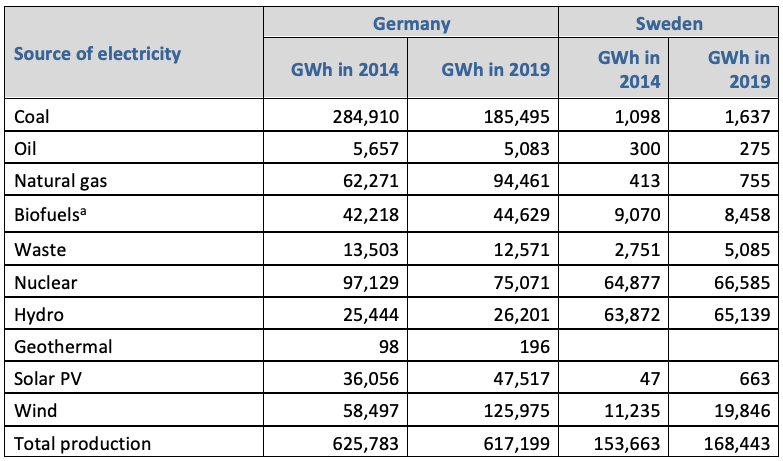
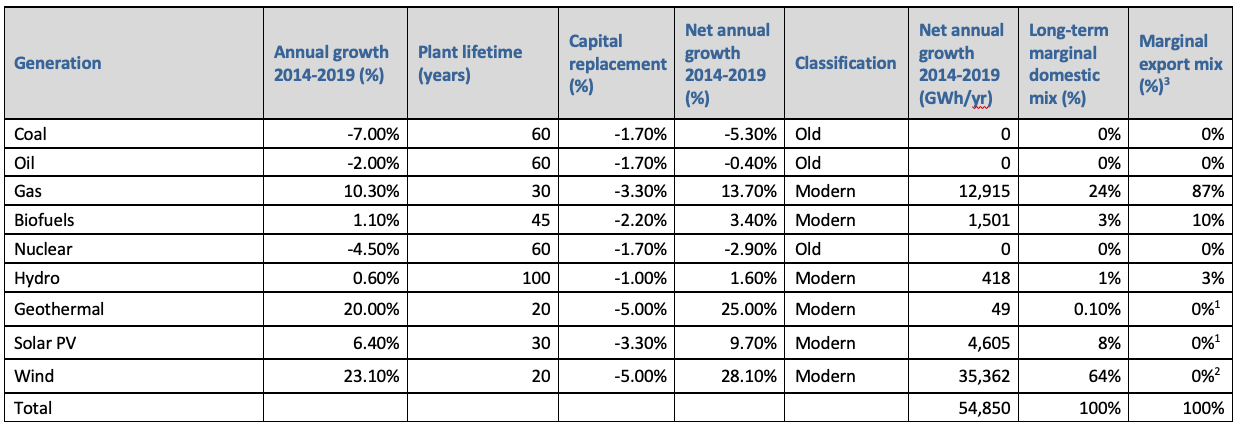
Table 4: Calculation of the long-term marginal export electricity mix for Germany, based on generation data shown in table 3.
1 Solar photovoltaic and geothermal are assumed not to constitute flexible supply, given that they typically supply at low voltage rather than to the high voltage network used to export electricity.
2 Wind power are not considered as flexible supply. Wind power has a tendency to be high and low across neighbouring countries at the same time. When wind power is low in Denmark, this is compensated with imports. However, imports of electricity to Denmark will typically not be from excess wind and will thus not stimulate expansion of wind technology in the exporting countries.
3 Normalized to 100% after excluding wind, solar and geothermal.
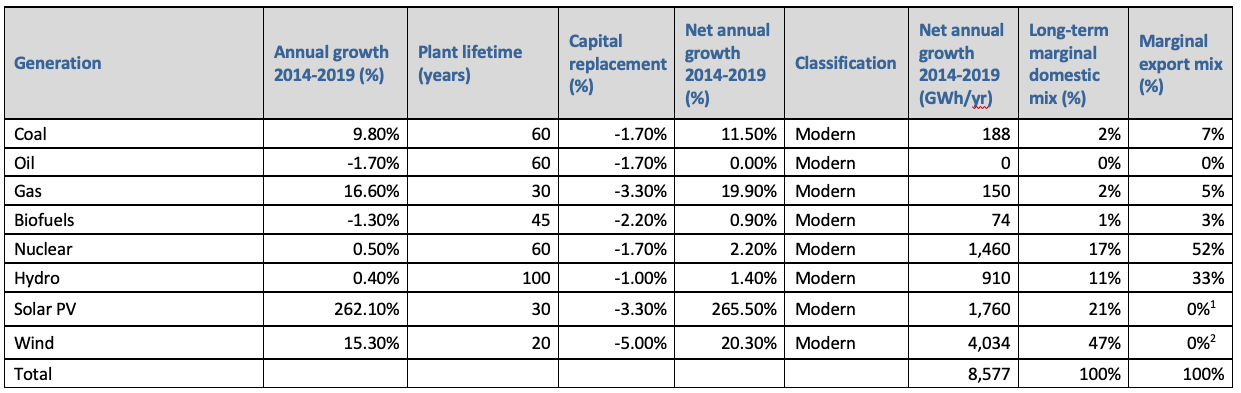
Table 5: Calculation of the long-term marginal export electricity mix for Sweden, based on generation data shown in table 3.
1 Solar photovoltaic and geothermal are assumed not to constitute flexible supply, given that they typically supply at low voltage rather than to the high voltage network used to export electricity.
2 Wind power are not considered as flexible supply. Wind power has a tendency to be high and low across neighbouring countries at the same time. When wind power is low in Denmark, this is compensated with imports. However, imports of electricity to Denmark will typically not be from excess wind and will thus not stimulate expansion of wind technology in the exporting countries.
3 Normalized to 100% after excluding wind and solar.
When the imports from Germany and Sweden are incorporated at the technology generation level into the Danish long-term marginal electricity mix previously calculated in Table 2, extrapolated from historical data in the period 2014-2019, the resulting mix is:
- 0.4% coal
- 23.6% gas
- 45.4% wind
- 20.7% biofuels
- 3% nuclear
- 2.6% hydropower
- 4.4% photovoltaic
This supplier mix is interesting given that we often see that coal and gas are attributed leading roles in many databases, despite the fact that many countries are actively reducing or phasing out these technologies. As an example all EU countries have made explicit commitments in this direction (see EU’s renewable energy national action plans: http://ec.europa.eu/energy/en/topics/renewable‐ energy/national‐action‐plans). Not adjusting for these political commitments in our models would lead to flawed results and potentially wrong decisions being made.
Information sources used
This example was originally based on a report made as a collaborative effort in a project, but this text has since been updated by the authors.
References
IEA (2021) Data and statistics. https://www.iea.org/data-and-statistics
UN (2021) UN Comtrade database. https://comtrade.un.org/data/
NREL (2010) Cost and Performance Assumptions for Modeling Electricity Generation Technologies. National Renewable Energy Laboratory, Golden, Colorado, http://www.nrel.gov/docs/fy11osti/48595.pdf
NREL (2004) Hydropower – setting a course for our energy future. National Renewable Energy Laboratory. https://www.nrel.gov/docs/fy04osti/34916.pdf
Authors of this example
Ivan Muñoz and Bo Weidema
Date
2023-09-20
How to reference this
Muñoz I, Weidema B P (2023), Example – Marginal Electricity in Denmark. Version: 2023-09-20. www.consequential-lca.org