Example – market for industrial fuels in Brazil
Generic product activity or name
Fuels for industrial production.
Synonyms
Power generation
Context and background
The present example illustrates how the marginal suppliers in a stable or slowly decreasing market can also be identified with the same procedures as in the situation of increasing production volume (as shown for Danish electricity). We discuss the situation for industrial fuel use in Brazil in the period 2011 to 2016.
Presentation of example
The goal of this example is to identify the marginal mix for fuels in the Brazilian industrial sector, using historical data. Figure 1 below displays the consumption of fuels by industrial users in Brazil in the period 2011 to 2016. This corresponds to fuels directly combusted on-site, as in e.g. cement and ceramic production plants. For the purpose of this example, consumption of energy in the form of heat produced off-site, by cogeneration plants or heat plants, is not included.
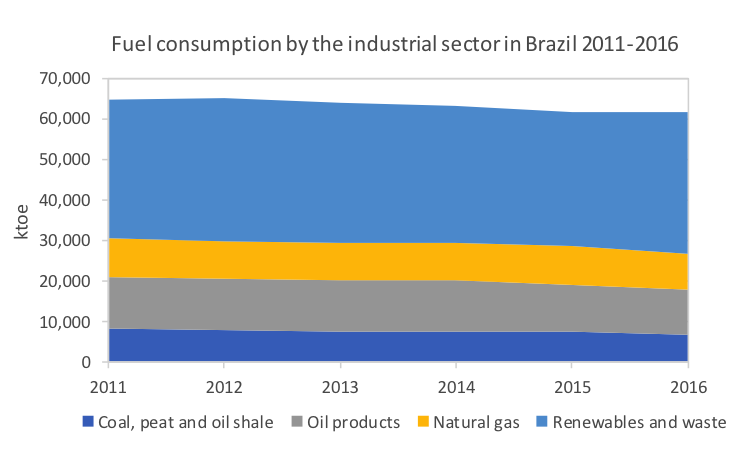
Figure 1. Consumption of fuels by the industrial sector in 2011-2016 (IEA 2018).
In figure 1 we can see that the overall use of fuels by the Brazilian industry seems to be slowly decreasing, at an average rate of 1% annually taking 2011 as reference. Furthermore, all four energy sources captured in the statistics show a decreasing trend. Even though all fuels have a decreasing trend, gas and renewables decrease at a lower rate than the capital replacement rate, which means they can be considered as modern technologies and therefore part of the marginal mix.
In table 1 we calculate the actual marginal fuel mix, taking into account the technology-specific decrease trend in the assessed period of time, as well the capital replacement rate, which is different for each technology (NREL 2010). The marginal mix is calculated in the final column, as the contribution of each technology to the net annual growth in 2011 to 2016.
Table 1: Calculation of the marginal fuel mix for Brazilian industry, based on fuel use shown in figure 1.
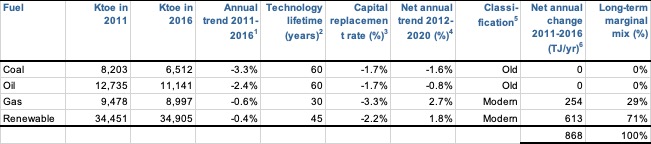
1 Relative to generation in 2011, calculated as an average trend (slope) considering the individual production values for 2011, 2012, 2013, 2014, 2015 and 2016.
2 From NREL (2010), assuming fuel combustion plants have similar lifetimes as power production plants. Renewables are assumed to be biomass.
3 Calculated as the inverse of the technology lifetime, with a minus sign.
4 Calculated as the annual growth 2011-2016 minus the capital replacement rate.
5 If the annual trend is lower than the capital replacement rate, the technology is considered as old.
6 Calculated as the generation in 2011 times the net annual trend.
Based on the calculation in table 1, the marginal fuel mix for the Brazilian industry, based on recent historical data is:
• 29% natural gas
• 71% renewable energy (assumed here to be biomass fuels)
References
IEA (2018) IEA Headline Global Energy Data (2018 edition). https://www.iea.org/media/statistics/IEA_HeadlineEnergyData.xlsx (accessed 2019-02-01)
NREL (2010), Cost and Performance Assumptions for Modeling Electricity Generation Technologies. National Renewable Energy Laboratory, Golden, Colorado, http://www.nrel.gov/docs/fy11osti/48595.pdf
Author of this example
Ivan Muñoz
Date
2020-10-01
How to reference this
Muñoz I (2020), Example – Market for industrial fuels in Brazil. Version: 2020-10-01 www.consequential-lca.org