Example – More than one determining product in rare earth oxides production
Please note: this example is included only because this was the only example of this situation included in the consequential system model of the ecoinvent database v. 3.0. However, later research (see http://lca-net.com/p/2951) has shown that a single determining product can be identified for rare earth production, which makes the below example obsolete.
Generic product activity or name
Rare earth oxides.
Synonyms
Bastnäsite concentrate, Cerium (Ce), Praseodymium (Pr), Neodymium (Nd), Lanthanum (La), Samarium (Sm), Light Rare Earths.
Context and background
The mineral bastnäsite is the most common mineral rich in rare earth elements (REE). The REE are difficult to extract from the mineral ores and the production of REE is thus very environmentally damaging. The REE are used to improve functional quality of various metal alloys and also has specific uses in such products as catalysts, lasers, ceramics, magnets, batteries and other electronics (Navarro and Zhao 2014). The REE have a strong affinity for oxides and the rare earth oxides (REO) are produced from sludge of REE.
Currently China is world’s leader in rare earth production representing around 95% of world production (British Geological survey 2015). The Bayan Obo mine in Inner Mongolia has more than 80% of Chinese reserves (Navarro and Zhao 2014).
Presentation of example
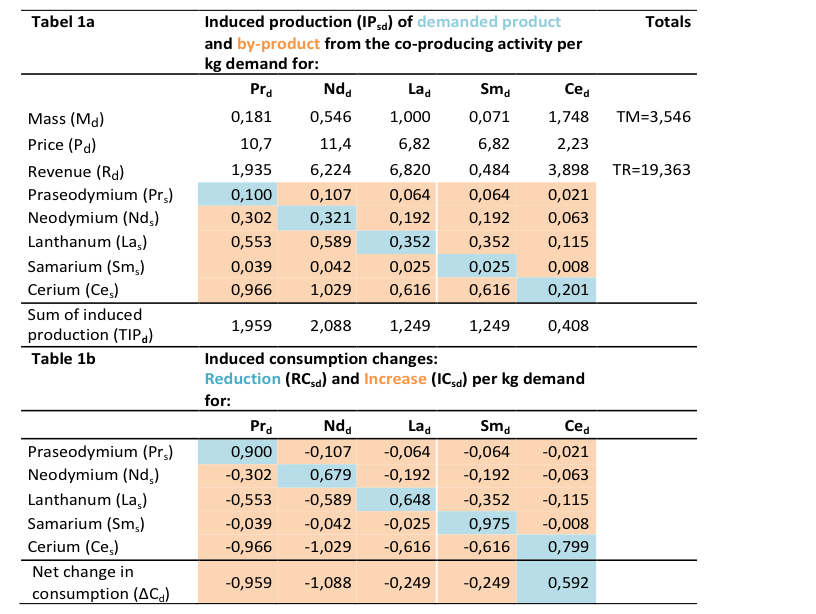
The rare earth oxides (REO) production in Bayan Obo, China has 5 REO co-products Cerium (Ce) concentrate, Praseodymium (Pr) oxide, Neodymium (Nd) oxide, Lanthanum (La) oxide, and Samarium (Sm) europium gadolinium concentrate, that have no alternative production systems. Because of this, they are all modelled as determining co-products and each oxide is analysed separately to identify the consequences of an isolated increase in demand for each of the 5 REO.
In table 1 we provide the analytical overview of the co-products and their contribution to revenue, induced production and consumption as well as the net changes in consumption that are induced by demanding more of each of the five by-products. We furthermore provide the formulas used to create the overview so that you can use them for your own analysis of other sets of multiple determining co-products.

Legend for table 1.
Productd = product demanded,
Products = product supplied,
Md = Mass of individual outputs,
Pd = Price Euro/kg (EUR2005),
TM = Total mass = ΣMd = (MPr + MNd + MLa + MSm + MCe),
Rd = Revenue of individual outputs (Md*Pd),
TR = Total Revenue =ΣRd = (RPr + RNd + RLa + RSm + RCe),
TIPd= Total induced production per kg co-product demanded = = (Rd/Md)*(TM/TR) = Pd*TM/TR
IPsd = Induced production for each specific co-product = TIPd*Ms/TM
RCsd = demanded product supplied from reduced consumption = 1-IPsd
ICsd = Induced Consumption = induced production not demanded = -IPsd
ΔCd= Net change in consumption = 1- TIPd
The first three rows of table 1a are the data from ecoinvent for mass, price and revenues for each co-product (ecoinvent 2015). The prices are not for the pure metals but for the concentrates or oxides that are the immediate output of the separation activity. The rows 4-9 in table 1a show a matrix of the induced production as a result of the demand for one kg of each of the five REOs. Looking down the columns, you see how the demand for one kg of a specific REO provides a revenue that induces a production of the amount TIPd shown in sum line. This amount is distributed over the co-products according to their relative masses.
Since the induced production is less than the demanded 1 kg, the remaining amount must come from other consumers’ reduction in consumption of that REO (the diagonal in table 1b). At the same time, the induced production supplies an additional amount of the non-demanded REOs, thus inducing an increased consumption of these (the off-diagonal numbers in table 1b), since all markets must be cleared.
The net change in consumption shown at the bottom of table 1b is the sum consumption changes (increased and reduced) – in other words the reaction of the markets to the initial demand of 1kg of a certain REO. You will see that this sum is equal to the induced production minus the 1 kg originally demanded. The resulting output of the entire system is thus the demanded product and nothing else. This result can also be verified for each single co-product by adding each element in Tables 1a and Tables 1b.
The diagonal in table 1b is also the numbers you will need to add as conditional exchanges to the markets for each of the co-products in databases such as ecoinvent in order induce the reduction in consumption (see figure 1 for an example: The 0.9 kg Pr is originally added as a conditional negative by-product to the market for Praseodymium and becomes a positive supply in the linking of the database).

Figure 1. Visualisation of the flows of co-products when demanding 1 kg Praseodymium oxide from the market.
Information sources used
We based this example on the various on-line information on Wikipedia and British Geological Survey for general information on the Light Rare Earths. Relative outputs and prices are from ecoinvent.
References
British Geological Survey (2015) World Mineral Production 2009-2013. https://nora.nerc.ac.uk/id/eprint/509929/1/WMP%202009-2013%20webversion.pdf (Accessed March 26. 2015)
ecoinvent Centre (2015). ecoinvent data version 3.1. Swiss Centre for Life Cycle Inventories, St. Gallen, retrieved from: www.ecoinvent.org
Navarro J, Zhao F (2014) Life-cycle assessment of the production of rare-earth elements for energy applications. Front. Energy Res., 06 November 2014 (on-line view: http://journal.frontiersin.org/article/10.3389/fenrg.2014.00045/full)
Wikipedia: http://en.wikipedia.org/wiki/Bastn%C3%A4site and http://en.wikipedia.org/wiki/Rare_earth_element
(Accessed March 26. 2015)
Author of this example
Bo Weidema
Date
2023-12-11
How to reference this
Weidema B P (2023), Example –More than one determining product in rare earth oxides production. Version: 2023-12-11 www.consequential-lca.org