Example – more than one determining product from chicken production
Generic product activity or name
Chicken production.
Synonyms
Chicken meat.
Context and background
The chicken production has six co-products (see table 1). Three of these (inedible offal, heads; feet and blood; feather) are by-products to be handled by system expansion in the normal way. While this aspect is not explained in detail in this example, some of the figures relevant for system expansion are presented in the grey section of the table. In this example we focus on the determining co-products (dark meat, breasts and wings). Read more in the example on how to identify the determining co-product.
Presentation of example
We must analyse the determining co-products separately to identify the consequences of an isolated increase in demand for each.
The analytical overview of the chicken co-products
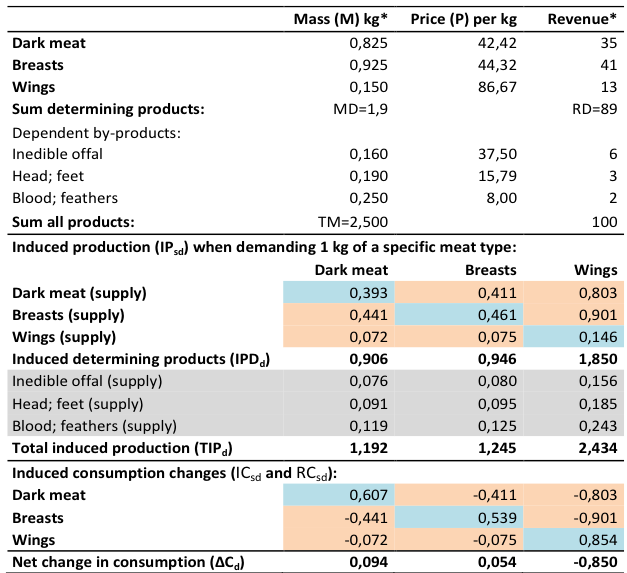
In table 1 we provide the analytical overview of the co-products and their contribution to revenue, induced production and consumption as well as the net changes in consumption that are induced by demanding more of each of the three by-products. We furthermore provide the formulas used to create the overview so that you can use them for your own analysis of other sets of multiple determining co-products.
Table 1. Analysis of the determining co-products of chicken production. Legend:
Productd = product demanded, Products = product supplied,
M = Mass of individual outputs,
MD = Mass of the determining products (MD = Mdark_meat + Mbreast + Mwing),
P = Price kg (calculated from FAO LEAP 2015 revenue percentages),
TM = Total mass = ΣMd = (TM = Mdark_meat + Mbreast + Mwing + Minedible_offall + Mhead_feet + Mblood_feathers),
R = Revenue of individual outputs (M*P),
RD =Revenue of determining products (RD = Rdark_meat + Rbreast + Rwing),
TIPd= Total induced production per kg co-product demanded = (Rd/Md)*(TM/RD) = Pd*TM/RD,
IPsd = Induced production for each specific co-product = TIPd*Ms/TM,
IPDd = Sum of induced production of determining products per kg co-product demanded = (Rd/Md)*(MD/RD) = Pd*(MD/RD),
RCsd = Demanded product supplied from reduced consumption = 1-IPsd,
ICsd = Increased consumption = Induced production not demanded = -IPsd,
ΔCd= Net change in consumption = 1- IPDd = ∑ RCsd + ICsd
* Data from FAO LEAP 2015, based on a summary of the average weight of different meat cuts and co-products from broiler leaving an average abattoir in the United States.
Understanding the production system
The upper part of the table is populated with the data from FAO for mass and revenues for each co-product (FAO LEAP 2015) and the prices calculated from these data. This part of the table indicates – maybe surprisingly – that the price (revenue/mass) for wings is relatively high, compared to the two other meat cuts.
Only the determining products provide sufficient revenue to drive production. Once they do this, the relation is as follows: if you pay RD=89, you stimulate TM=2.5 kg production of chicken meat.
Inducing a production for a specific product
In a consequential LCA you may investigate what happens when the demand for a specific meat type increases by 1 kg. Details of what happens is shown in the middle section of the table. Let us say you want dark meat and you pay Pd=42,42 for that (= Rd/Md=35/0,825). The price you pay induces a total production of TIPd. But the dark meat, in fact, only constitutes IPsd = 0,825/2,500 * 1,192 = 0,393 of the induced production.
Understanding the consumption changes
Since the induced amount is less than the 1 kg dark meat you wanted, the remaining amount must come from other consumers’ reduction in consumption of that dark meat type. This is show in the last section of the table. Here we see that the reduced consumption (missing supply of demanded product) for the dark meat is RCsd = 1-IPsd, = 0,607 kg.
At the same time, the induced production of demanding 1 kg of dark meat supplied an additional amount (excess supply) of the non-demanded meat cuts thus inducing an increased consumption of these (breast=0,441 and wings=0,072), since all markets must be cleared. The excess supply (IPsd) of non-demanded meat types is removed by increased consumption (ICsd = -IPsd) by the marginal consumers. Note: this modelling is based on the assumption that the affected marginal consumers do not substitute with any other product, except other joint products from the same activity.
The net change in consumption is low for the dark meats and breasts, showing that these products could be grouped as one, without introducing any significant error. For wings, on the other hand, the change in consumption of other meat cuts is significant, which shows that it may not be reasonable to group the wings together with the other meat cuts. This is a direct consequence of the significant difference in price of the wings relative to the other cuts.
The second part of the video here uses the chicken wings from this example to illustrate the general concept of consumption changes when there are more than one determining product from a joint production.
Information sources used
This example is based on FAO LEAP (2015) poultry data (US-data) and a feedback given by Bo Weidema during a hearing process that took place in 2014 (Weidema 2014).
References
OECD-FAO (2014). OECD-FAO agricultural outlook 2014, OECD publishing.
http://www.oecd.org/site/oecd-faoagriculturaloutlook/meat.htm (accessed 29. September, 2014.)
FAO LEAP (2015). Greenhouse gas emissions and fossil energy use from poultry supply chains. Guidelines for assessment, version 1. http://www.fao.org/3/a-mj752e.pdf (accessed 28. April 2014.)
Weidema B (2014). Bo Weidema’s comments on the LEAP guideline on “Greenhouse gas emissions and fossil energy demand from poultry supply chains”. 2.-0 LCA consultants: http://lca-net.com/?p=2055
Author of this example
Bo Weidema
Date
2018-04-24
How to reference this
Weidema B P (2014), Example – more than one determining product from chicken production. Version:2015-12-08 www.consequential-lca.org